Russland und die Ukraine sind bedeutende Getreide-Produzenten. Doch wie hoch genau ist der Anteil der beiden Länder an der globalen Produktion von Weizen, Mais und Gerste? Um Ihnen einen schnellen Überblick zu ermöglichen, hat der DRV für Sie die wichtigsten Kennzahlen und ihre Entwicklung seit 2021 dargestellt. Da sich der Krieg in der Ukraine auch auf weitere Bereiche der Agrar-, Ernährungs- und Energiewirtschaft auswirkt, beinhaltet die Zusammenstellung auch Fakten zu Ölsaaten, Rindfleisch, Schweinefleisch, Milch und Milchprodukten sowie zu Energieprodukten wie Erdöl oder Erdgas.
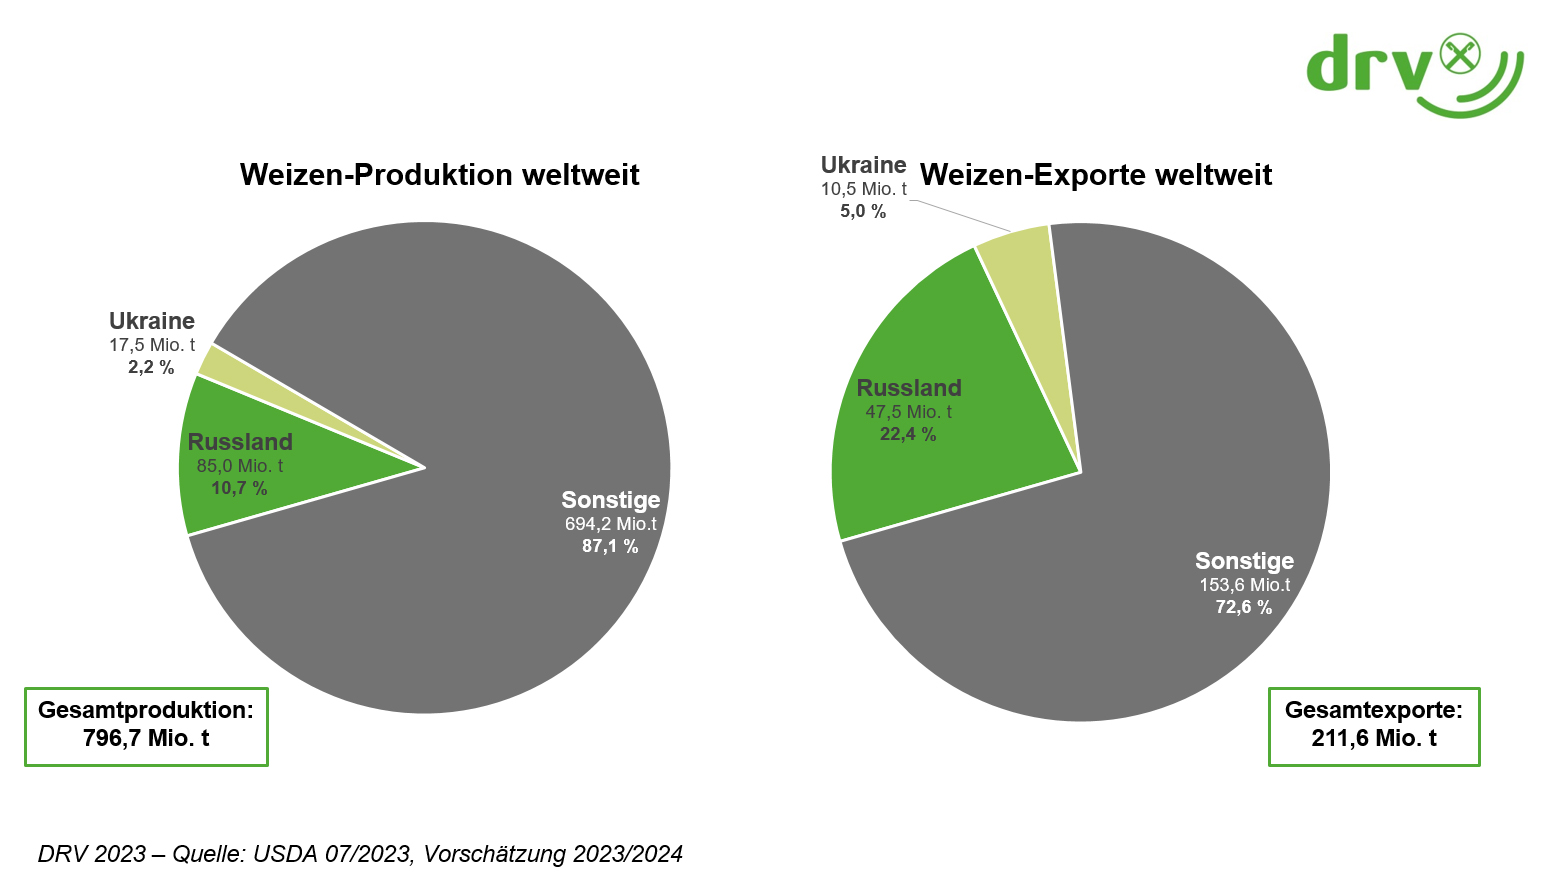
| Weizen: Schätzung 23/24 | Produktion | Importe | Exporte | |
|---|---|---|---|---|
| Welt | 796,7 Mio. t | 208,0 Mio. t | 211,6 Mio. t | |
| EU* | 136,1 Mio. t | 6,6 Mio. t | 32,7 Mio. t | |
| Russland | 85,0 Mio. t | 0,3 Mio. t | 47,5 Mio. t | |
| Ukraine | 17,5 Mio. t | 0,1 Mio. t | 10,5 Mio. t | |
| Anteil am Weltmarkt | ||||
| Russland | 10,7 % | 0,1 % | 22,4 % | |
| Ukraine | 2,2 % | - | 5,0 % | |
* Quelle: EU-Kommission
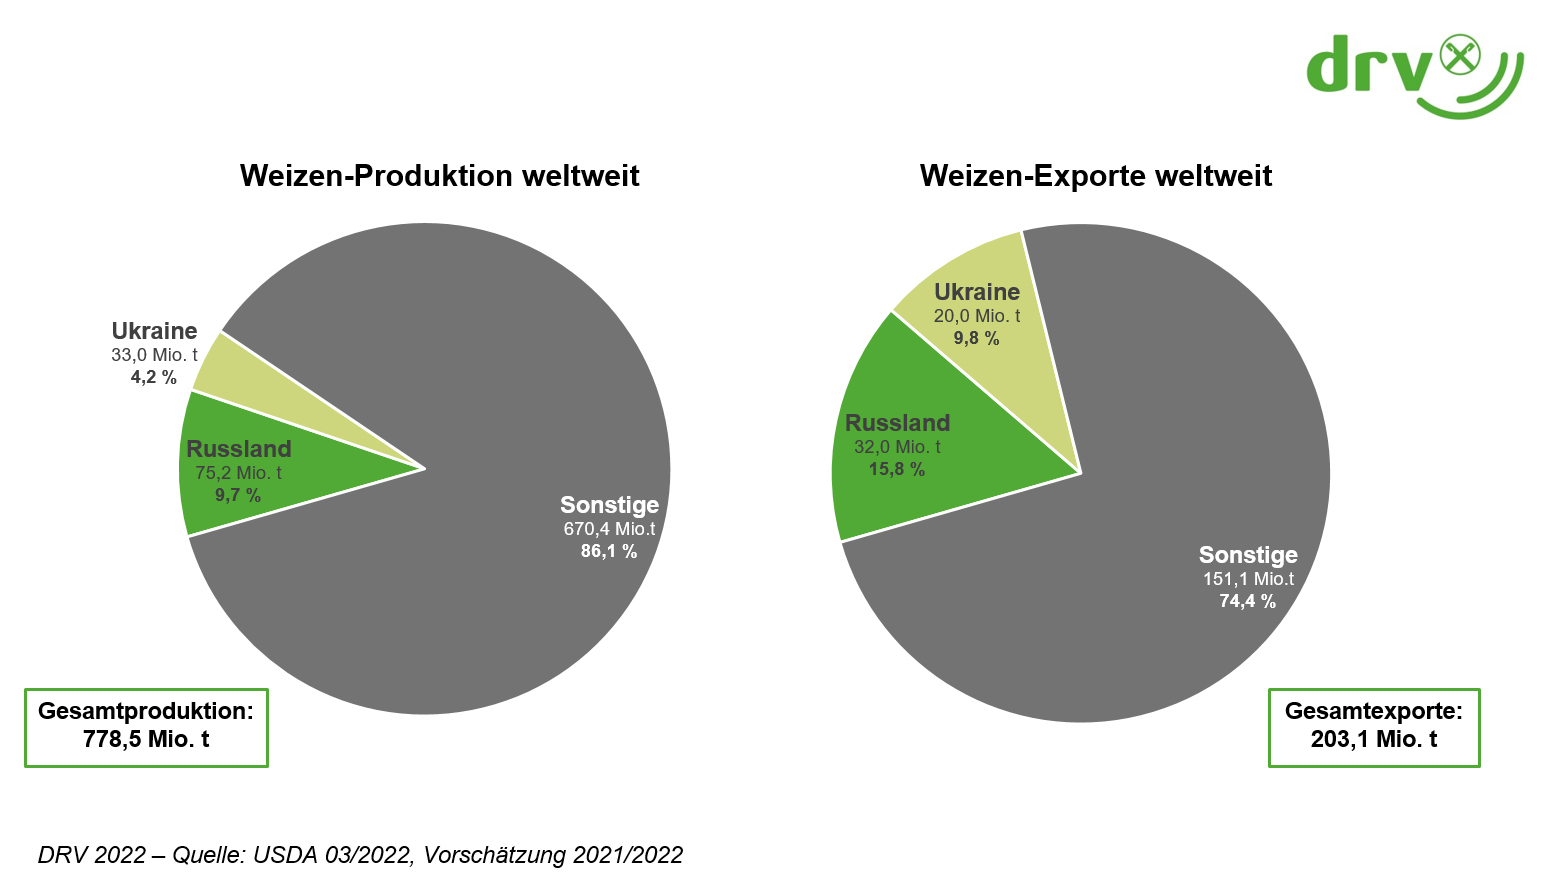
| Weizen: Schätzung 21/22 | Produktion | Importe | Exporte | |
|---|---|---|---|---|
| Welt | 778,5 Mio. t | 201,3 Mio. t | 203,1 Mio. t | |
| EU | 138,6 Mio. t | 4,4 Mio. t | 29,9 Mio. t | |
| Russland | 75,2 Mio. t | 0,3 Mio. t | 32,0 Mio. t | |
| Ukraine | 33,0 Mio. t | 0,1 Mio. t | 20,0 Mio. t | |
| Anteil am Weltmarkt | ||||
| Russland | 9,7 % | 0,1 % | 15,8 % | |
| Ukraine | 4,2 % | - | 9,8 % | |
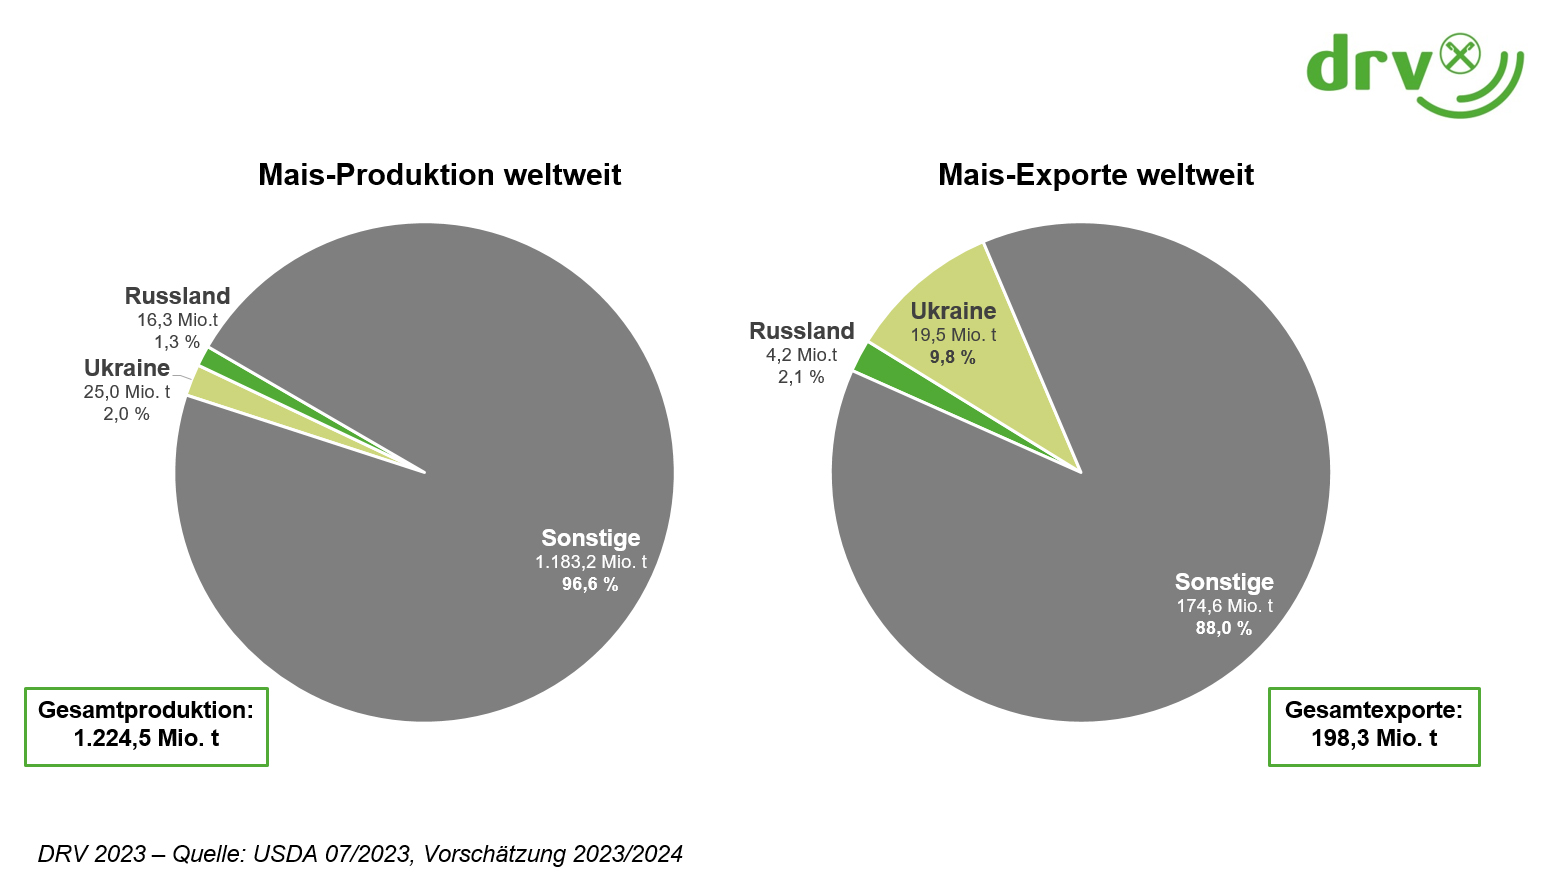
| Mais: Schätzung 23/24 | Produktion | Importe | Exporte | |
|---|---|---|---|---|
| Welt | 1224,5 Mio. t | 188,4 Mio. t | 198,3 Mio. t | |
| EU | 63,4 Mio. t | 24,0 Mio. t | 5,0 Mio. t | |
| Russland | 16,3 Mio. t | 0,1 Mio. t | 4,2 Mio. t | |
| Ukraine | 25,0 Mio. t | - | 19,5 Mio. t | |
| Anteil am Weltmarkt | ||||
| Russland | 1,3 % | - | 2,1 % | |
| Ukraine | 2,0 % | - | 9,8 % | |
| Mais: Schätzung 21/22 | Produktion | Importe | Exporte | |
|---|---|---|---|---|
| Welt | 1206,1 Mio. t | 185,6 Mio. t | 199,9 Mio. t | |
| EU | 72,8 Mio. t | 14,1 Mio. t | 5,6 Mio. t | |
| Russland | 15,2 Mio. t | - | 4,5 Mio. t | |
| Ukraine | 41,9 Mio. t | - | 27,5 Mio. t | |
| Anteil am Weltmarkt | ||||
| Russland | 1,3 % | - | 2,3 % | |
| Ukraine | 3,5 % | - | 13,8 % | |

| Gerste: Schätzung 23/24 | Produktion | Importe | Exporte | |
|---|---|---|---|---|
| Welt | 145,8 Mio. t | 26,4 Mio. t | 27,1 Mio. t | |
| EU | 50,4 Mio. t | 1,1 Mio. t | 6,5 Mio. t | |
| Russland | 19,6 Mio. t | 0,1 Mio. t. | 4,5 Mio. t | |
| Ukraine | 5,7 Mio. t | - | 1,8 Mio. t | |
| Anteil am Weltmarkt | ||||
| Russland | 13,4 % | 0,2% | 16,6 % | |
| Ukraine | 3,9 % | - | 6,7 % | |

| Gerste: Schätzung 21/22 | Produktion | Importe | Exporte | |
|---|---|---|---|---|
| Welt | 146,1 Mio. t | 34,4 Mio. t | 34,8 Mio. t | |
| EU | 52,4 Mio. t | 0,9 Mio. t | 11,8 Mio. t | |
| Russland | 17,5 Mio. t | 0,1 Mio. t. | 4,5 Mio. t | |
| Ukraine | 9,9 Mio. t | - | 5,8 Mio. t | |
| Anteil am Weltmarkt | ||||
| Russland | 12,0 % | 0,1% | 12,9 % | |
| Ukraine | 6,8 % | - | 16,7 % | |

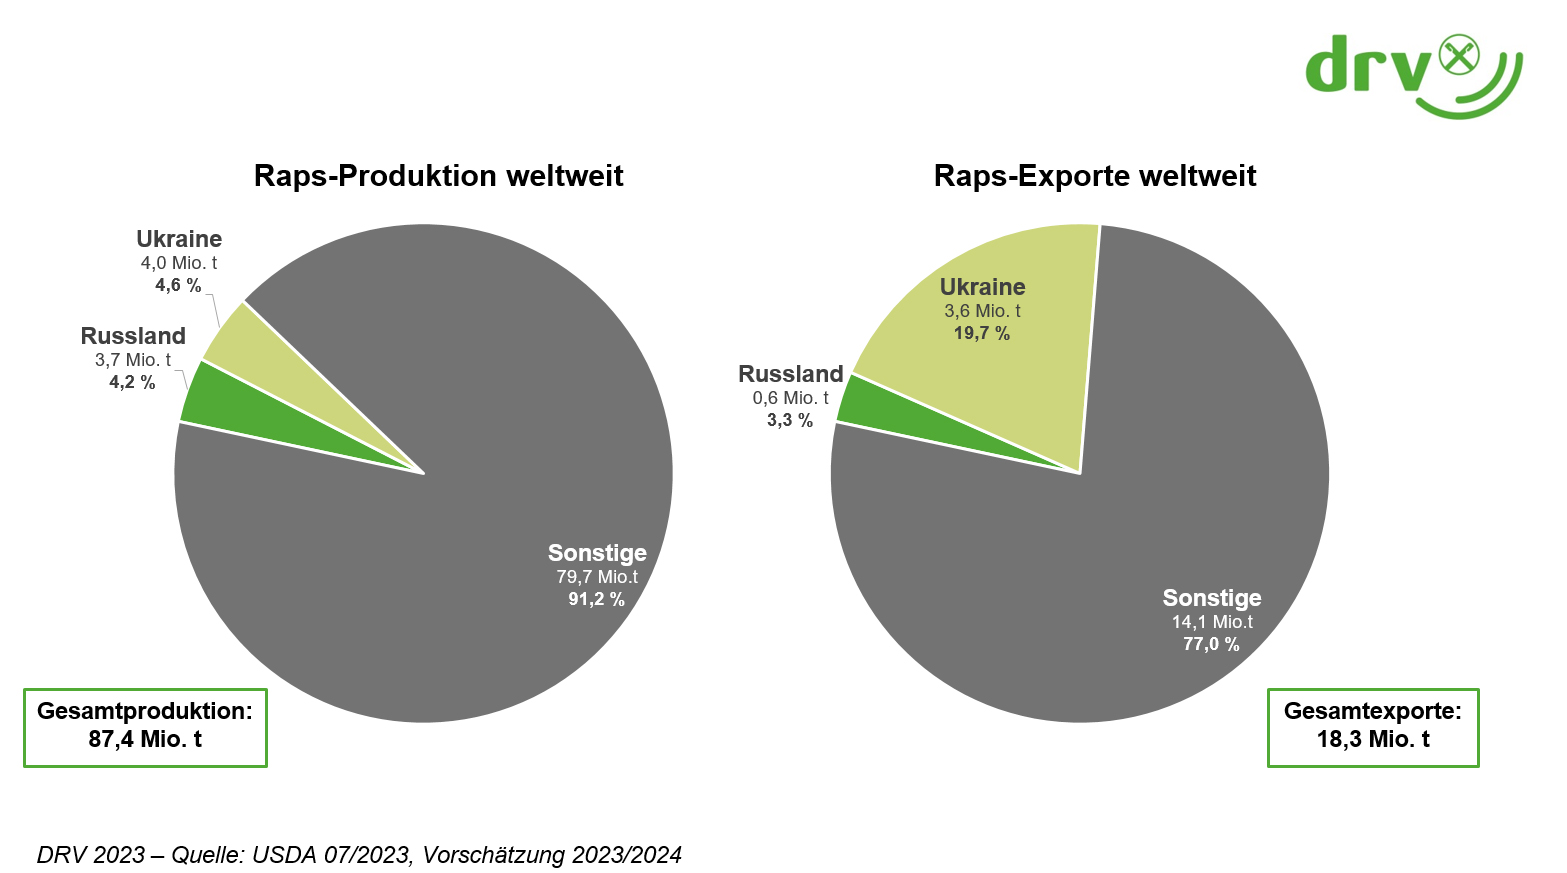
| Raps: Schätzung 23/24 | Produktion | Importe | Exporte | |
|---|---|---|---|---|
| Welt | 87,4 Mio. t | 16,8 Mio. t. | 18,3 Mio. t | |
| EU | 20,2 Mio. t | 5,1 Mio. t. | 0,5 Mio. t | |
| Russland | 3,7 Mio. t | - | 0,6 Mio. t | |
| Ukraine | 4,0 Mio. t | - | 3,6 Mio. t | |
| Anteil am Weltmarkt | ||||
| Russland | 4,2 % | 0,1 % | 3,0 % | |
| Ukraine | 4,3 % | 0,1 % | 19,3 % | |
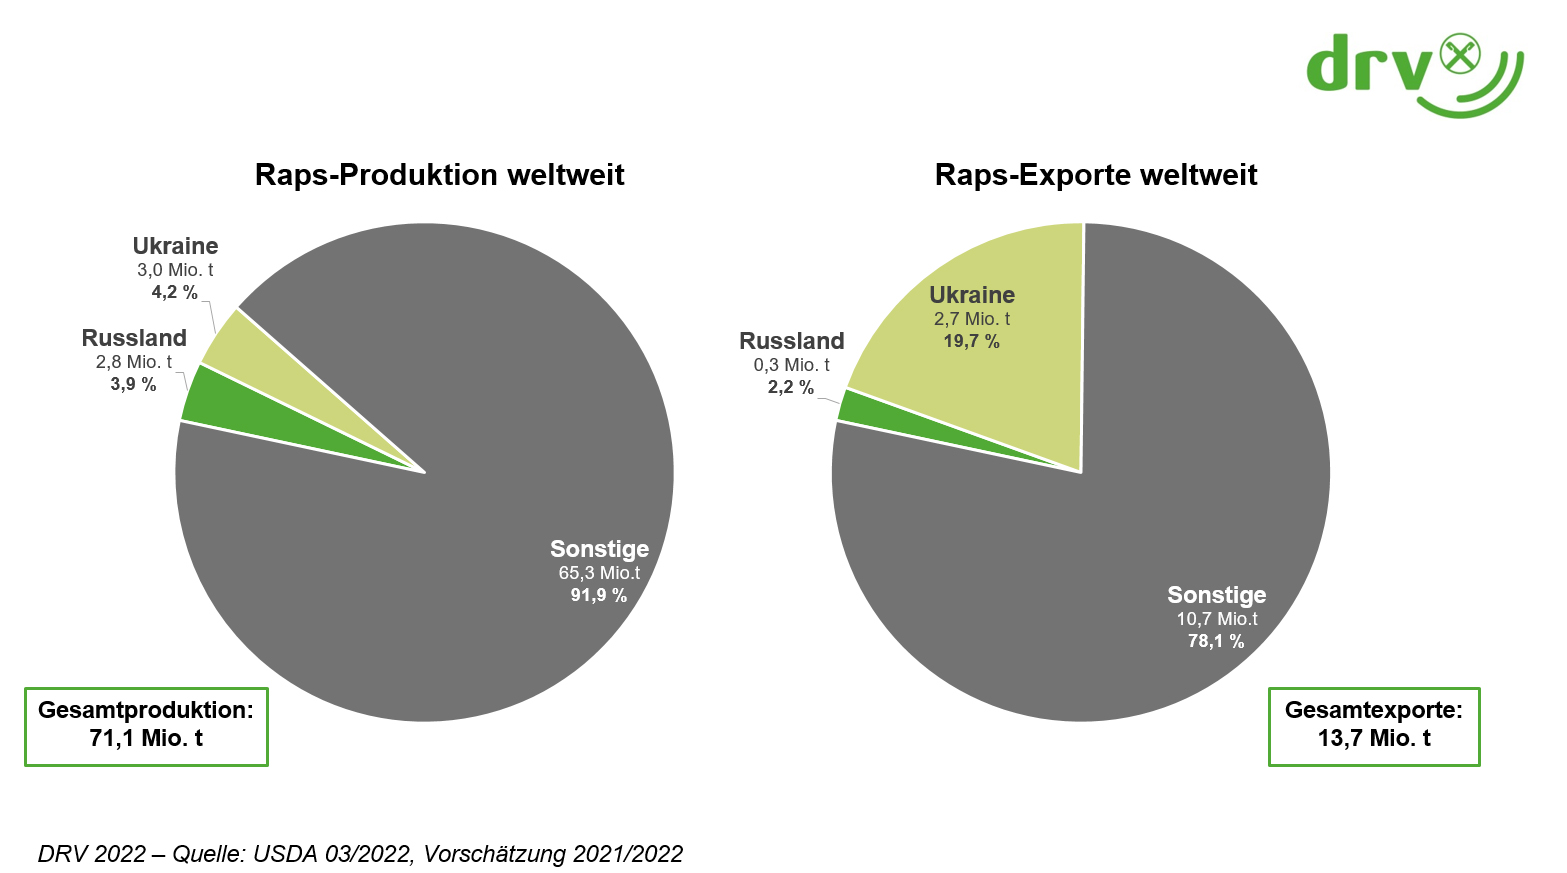
| Raps: Schätzung 21/22 | Produktion | Importe | Exporte | |
|---|---|---|---|---|
| Welt | 71,1 Mio. t | 14,0 Mio. t. | 13,7 Mio. t | |
| EU | 17,0 Mio. t | 5,0 Mio. t. | 0,4 Mio. t | |
| Russland | 2,8 Mio. t | - | 0,3 Mio. t | |
| Ukraine | 3,0 Mio. t | - | 2,7 Mio. t | |
| Anteil am Weltmarkt | ||||
| Russland | 3,9 % | 0,3% | 2,2 % | |
| Ukraine | 4,2 % | 0,1% | 19,7 % | |
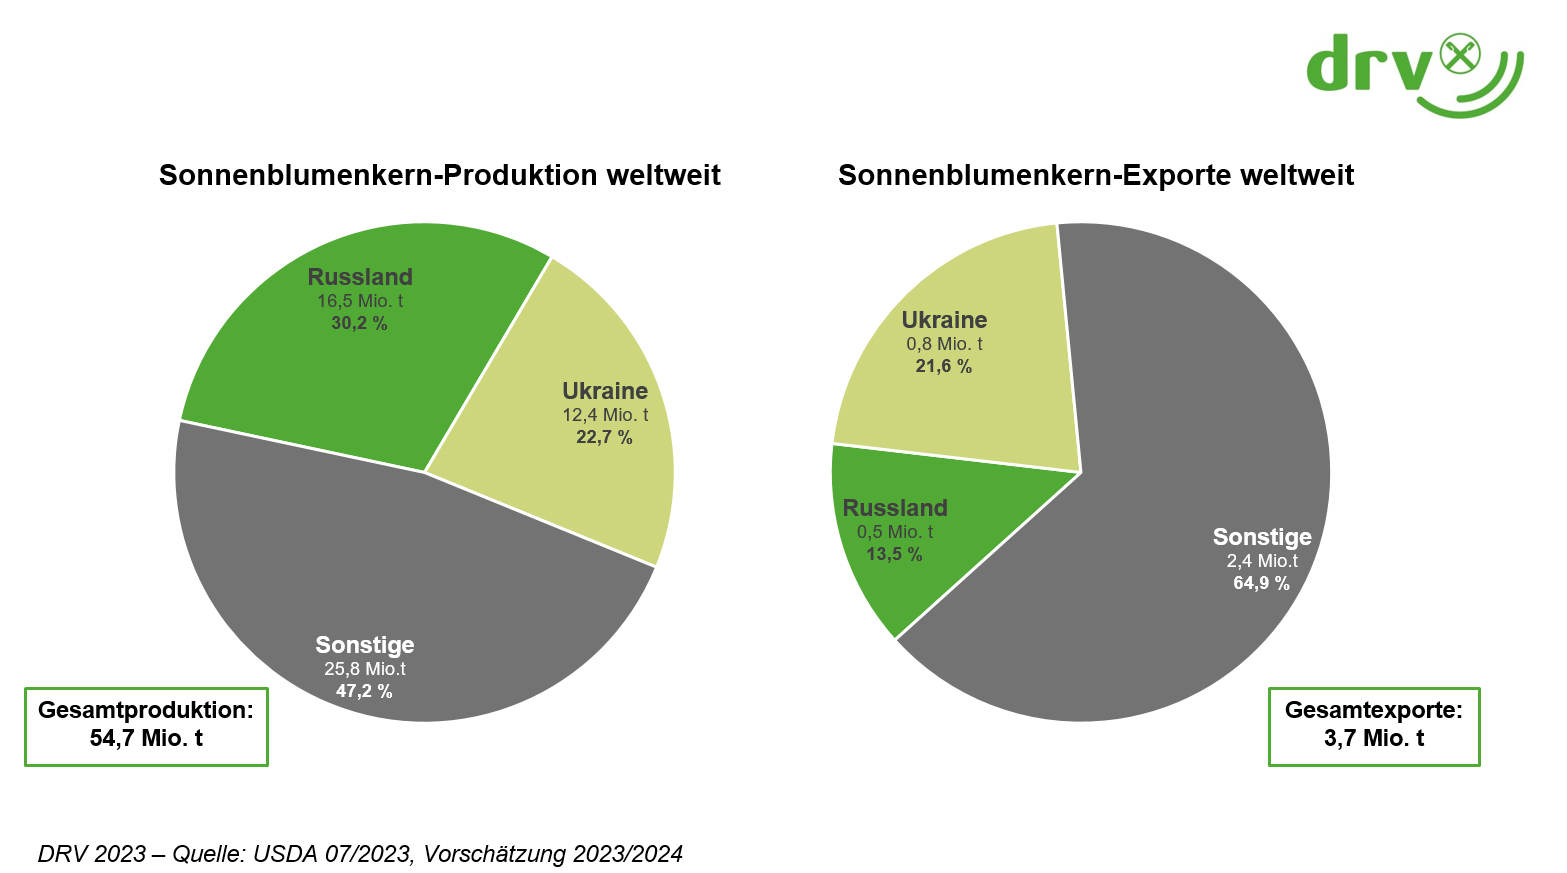
| Sonnenblumenkerne: Schätzung 23/24 | Produktion | Importe | Exporte | |
|---|---|---|---|---|
| Welt | 54,7 Mio. t | 3,4 Mio. t | 3,7 Mio. t | |
| EU | 11,5 Mio. t | 0,8 Mio. t | 0,7 Mio. t | |
| Russland | 16,5 Mio. t | 0,1 Mio. t | 0,5 Mio. t | |
| Ukraine | 12,4 Mio. t | 0,0 Mio. t | 0,8 Mio. t | |
| Anteil am Weltmarkt | ||||
| Russland | 30,2 % | 1,5 % | 13,4 % | |
| Ukraine | 22,7 % | 0,3 % | 21,4 % | |
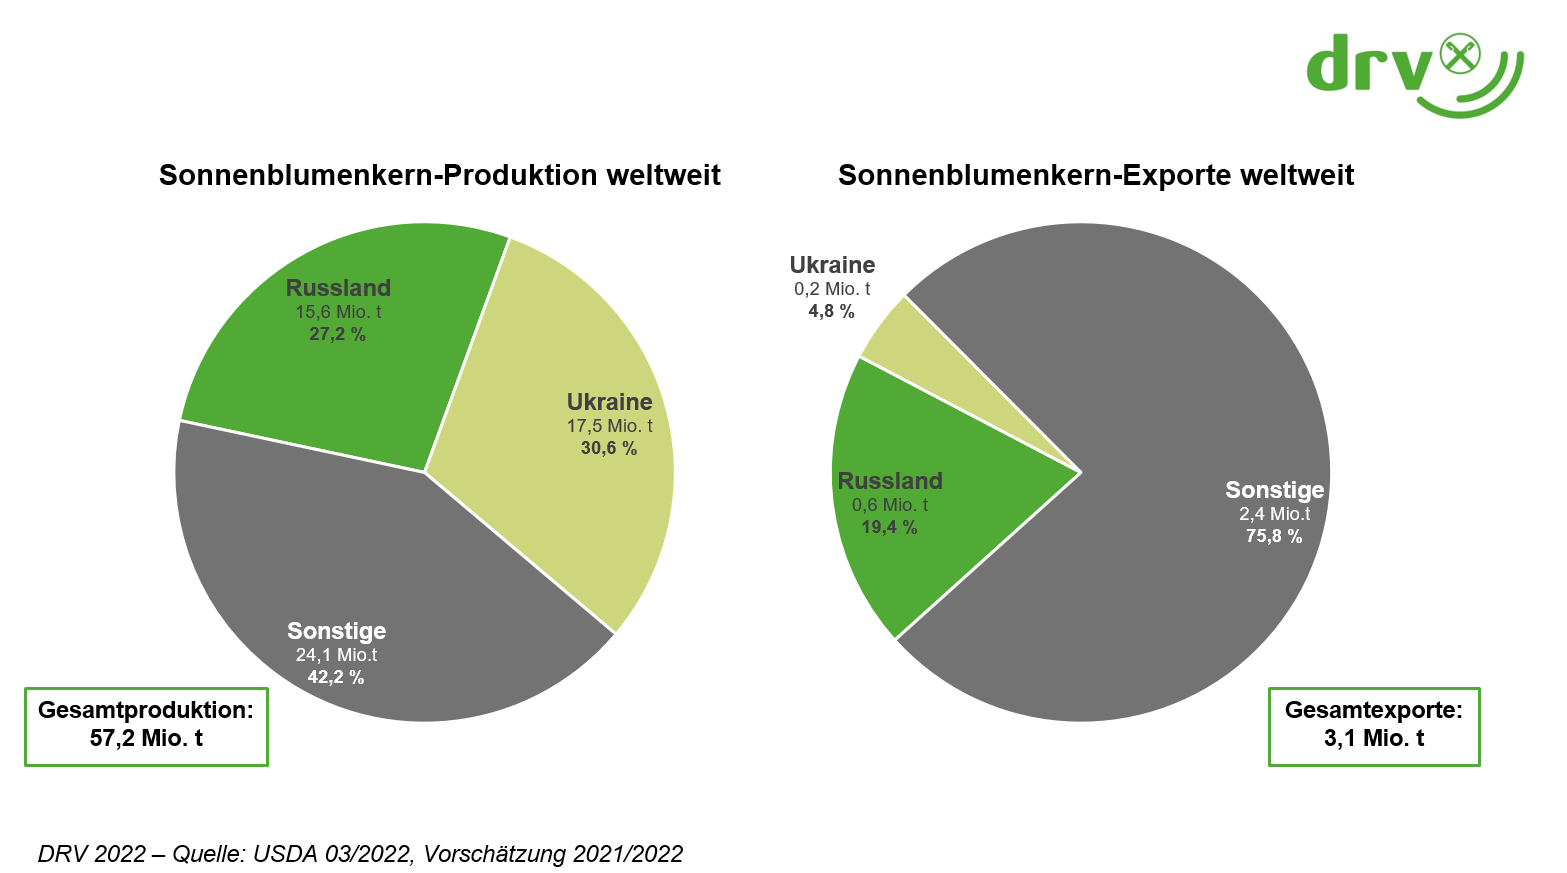
| Sonnenblumenkerne: Schätzung 21/22 | Produktion | Importe | Exporte | |
|---|---|---|---|---|
| Welt | 57,2 Mio. t | 2,7 Mio. t | 3,1 Mio. t | |
| EU | 10,5 Mio. t | 0,4 Mio. t | 0,6 Mio. t | |
| Russland | 15,6 Mio. t | 0,1 Mio. t | 0,6 Mio. t | |
| Ukraine | 17,5 Mio. t | 0,0 Mio. t | 0,2 Mio. t | |
| Anteil am Weltmarkt | ||||
| Russland | 27,2 % | 1,8 % | 19,4 % | |
| Ukraine | 30,6 % | 0,7 % | 4,8 % | |
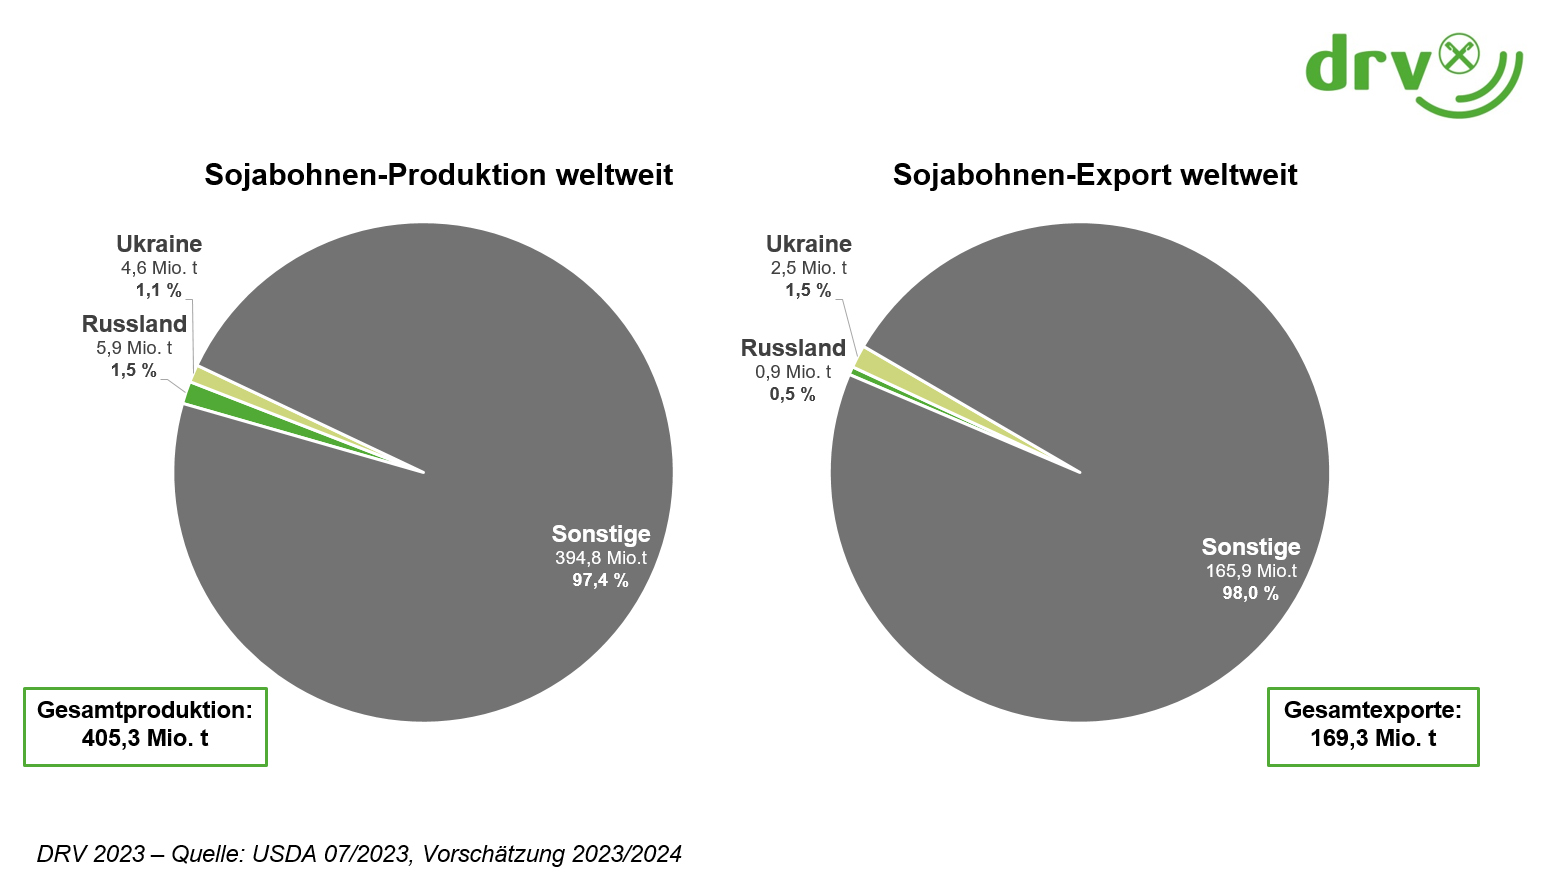
| Sojabohnen: Schätzung 23/24 | Produktion | Importe | Exporte | |
|---|---|---|---|---|
| Welt | 405,3 Mio. t | 166,6 Mio. t | 169,3 Mio. t | |
| EU | 3,2 Mio. t | 14,0 Mio. t | 0,3 Mio. t | |
| Russland | 5,9 Mio. t | 1,4 Mio. t. | 0,9 Mio. t | |
| Ukraine | 4,6 Mio. t | 0,0 Mio. t. | 2,5 Mio. t | |
| Anteil am Weltmarkt | ||||
| Russland | 1,5 % | 0,8% | 0,5 % | |
| Ukraine | 1,1 % | 0,0% | 1,5 % | |
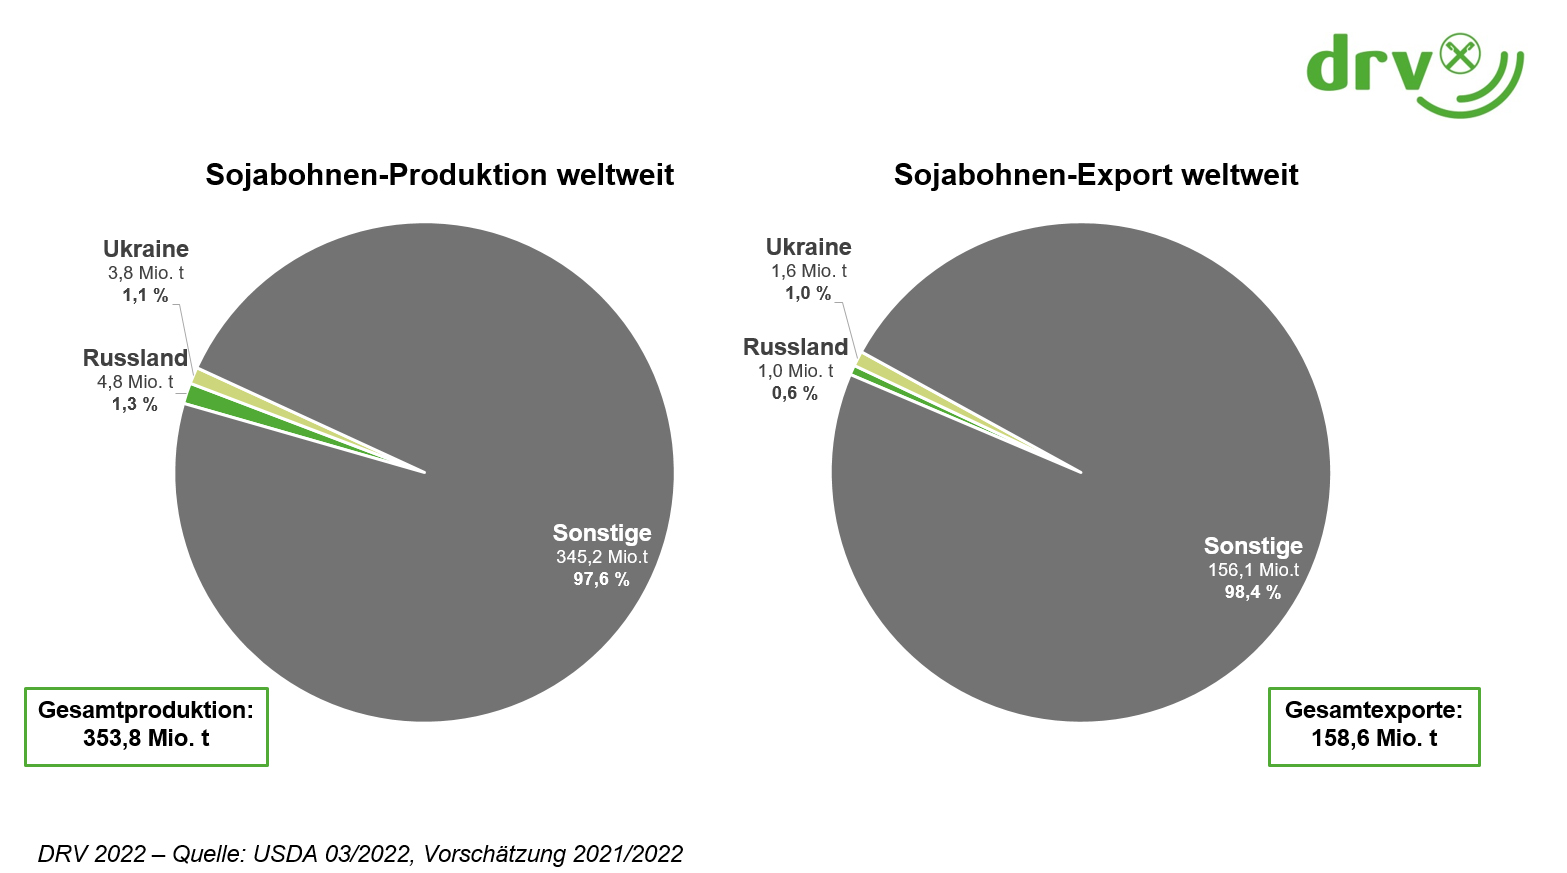
| Sojabohnen: Schätzung 21/22 | Produktion | Importe | Exporte | |
|---|---|---|---|---|
| Welt | 353,8 Mio. t | 156,7 Mio. t | 158,6 Mio. t | |
| EU | 2,7 Mio. t | 14,6 Mio. t | 0,3 Mio. t | |
| Russland | 4,8 Mio. t | 1,6 Mio. t. | 1,0 Mio. t | |
| Ukraine | 3,8 Mio. t | 0,0 Mio. t. | 1,6 Mio. t | |
| Anteil am Weltmarkt | ||||
| Russland | 1,3 % | 1,0% | 0,6 % | |
| Ukraine | 1,1 % | 0,0% | 1,0 % | |
| Rindfleisch | Produktion | Importe | Exporte | |
|---|---|---|---|---|
| Welt | 71,6 Mio. t | 11,1 Mio. t | 11,8 Mio. t | |
| Russland | 1,6 Mio. t | 0,3 Mio. t | 0,1 Mio. t | |
| Ukraine | 0,3 Mio. t | - | - | |
| Anteil am Weltmarkt | ||||
| Russland | 2,3 % | 3,4 % | 0,6 % | |
| Ukraine | 0,5 % | 0,1 % | 0,3 % | |

| Schweinefleisch | Produktion | Importe | Exporte | |
|---|---|---|---|---|
| Welt | 109,7 Mio. t | 12,7 Mio. t | 12,9 Mio. t | |
| Russland | 4,3 Mio. t | - | 0,2 Mio. t | |
| Ukraine | 0,7 Mio. t | - | - | |
| Anteil am Weltmarkt | ||||
| Russland | 3,9 % | 0,3 % | 1,5 % | |
| Ukraine | 0,6 % | 0,3 % | - | |

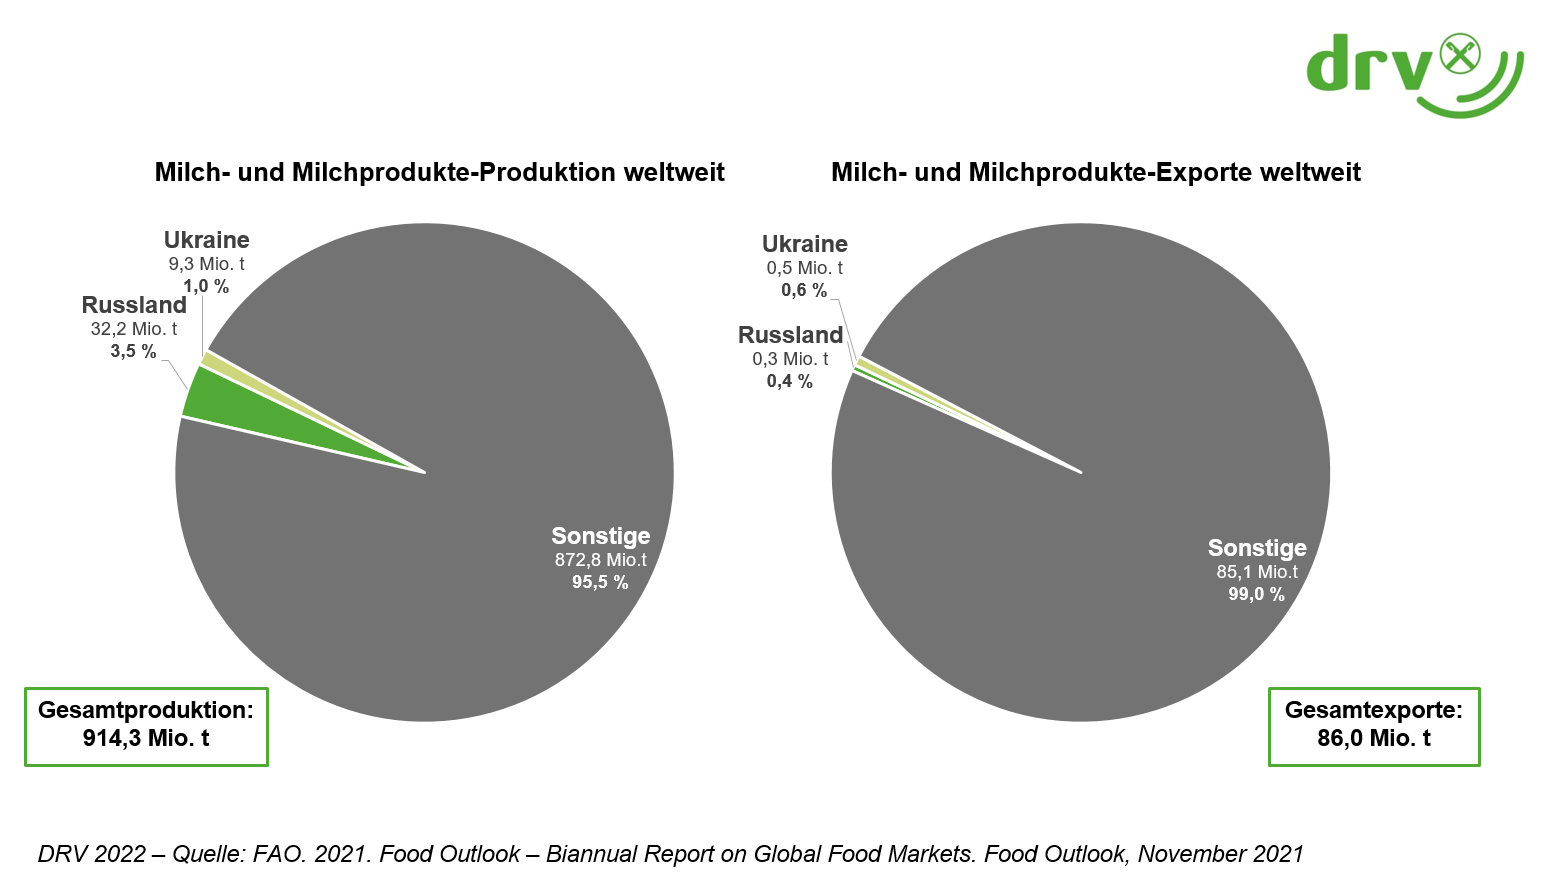
| Milch und Milchprodukte | Produktion | Importe | Exporte | |
|---|---|---|---|---|
| Welt | 914,3 Mio. t | 85,0 Mio. t | 86,0 Mio. t | |
| Russland | 32,2 Mio. t | 3,9 Mio. t | 0,3 Mio. t | |
| Ukraine | 9,3 Mio. t | 0,4 Mio. t | 0,5 Mio. t | |
| Anteil am Weltmarkt | ||||
| Russland | 3,5 % | 4,5 % | 0,4 % | |
| Ukraine | 1,0 % | 0,4 % | 0,6 % | |
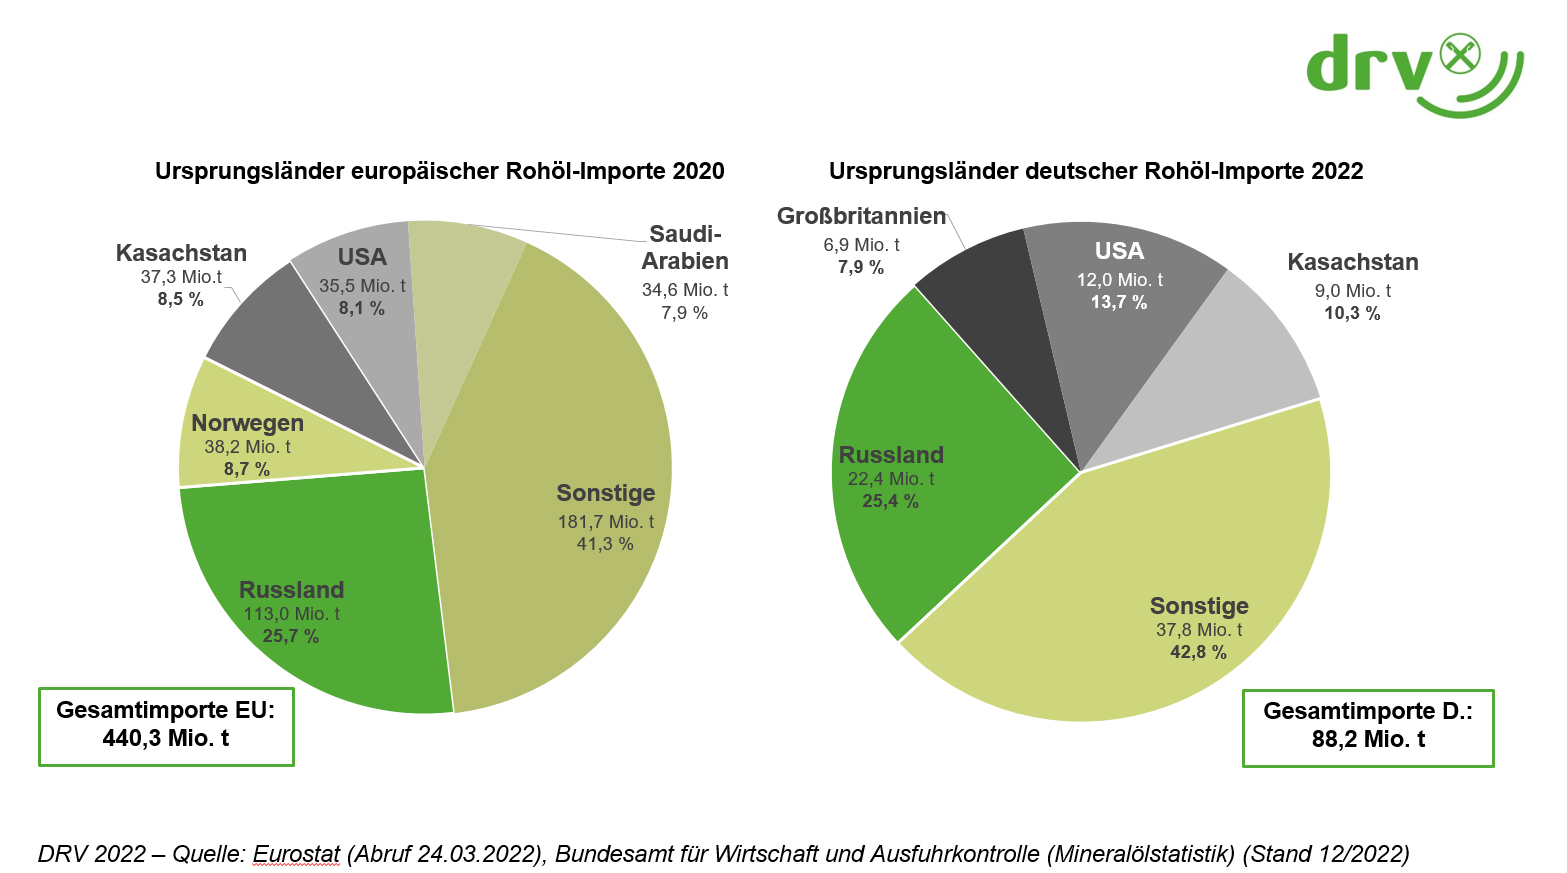
| Rohöl-Import D | Menge | Anteil | |
|---|---|---|---|
| Russland | 22,4 Mio. t | 25,4 % | |
| USA | 12,0 Mio. t | 13,7 % | |
| Kasachstan | 9,0 Mio. t | 10,3 % | |
| Großbritannien | 6,9 Mio. t | 7,9 % | |
| Sonstige | 37,8 Mio. t | 42,8 % | |
| Rohöl-Import EU | Menge | Anteil | |
|---|---|---|---|
| Russland | 113,0 Mio. t | 25,7 % | |
| Norwegen | 38,2 Mio. t | 8,7 % | |
| Kasachstan | 37,3 Mio. t | 8,5 % | |
| USA | 35,5 Mio. t | 8,1 % | |
| Saudi-Arabien | 34,6 Mio. t | 7,9 % | |
| Sonstige | 181,7 Mio. t | 41,3 % | |
| Erdgas-Import D | Menge | Anteil | |
|---|---|---|---|
| Russland | 56,3 Mrd. m³ | 55,1 % | |
| Norwegen | 31,2 Mrd. m³ | 30,6 % | |
| Niederlande | 13,0 Mrd. m³ | 12,7 % | |
| übriges Europa | 1,6 Mrd. m³ | 1,6 % | |
| Erdgas-Import EU | Menge | Anteil | |
|---|---|---|---|
| Russland | 167,7 Mrd. m³ | 37,5 % | |
| Norwegen | 106,9 Mrd. m³ | 23,9 % | |
| übriges Europa | 100,7 Mrd. m³ | 22,5 % | |
| Niederlande | 28,1 Mrd. m³ | 6,3 % | |
| Algerien | 21,0 Mrd. m³ | 4,7 % | |
| Aserbaidschan | 13,4 Mrd. m³ | 3,0 % | |
| Iran | 5,1 Mrd. m³ | 1,1 % | |
| Libyen | 4,2 Mrd. m³ | 0,9 % | |